Job Monitoring
Monitoring a Spark job submitted on the cluster can be done in two ways: using the default Yarn tools that come with the Hadoop platform or using the MEP JobControl application.
Monitoring using the default Yarn tools
When submitting a Spark job on the Hadoop cluster, it can be monitored using the ResourceManager UI that comes with the Hadoop platform. On your user VM, make sure you have a valid Kerberos ticket (run kinit and provide the password), open a Firefox web browser and navigate to http://epod-master1.vgt.vito.be:8088/cluster.
To retrieve the logs for jobs that have finished (failed or succeeded), you can use the yarn logs command, e.g:
yarn logs -applicationId application_1501828556448_12243
To retrieve the logs of a running application you will need to navigate to the Spark UI by clicking the tracking URL link. When selecting the 'Executors' tab, you can find links to the logs.
Monitoring using the JobControl application
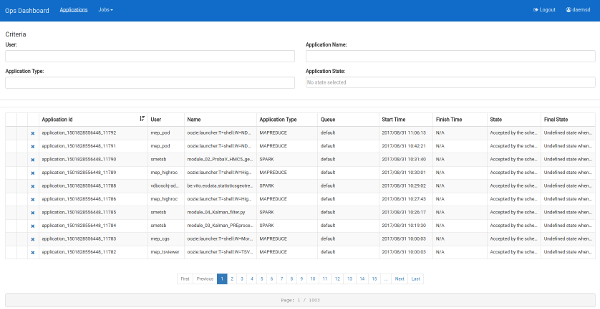
The MEP JobControl application tries to simplify job monitoring and log retrieval by providing log retrieval of active and finished jobs through a single user interface.
Sign in with your MEP username and password.
You can filter jobs on application name, type and state (e.g. running, failed, ...).
In the application list you can:
 retrieve the logs of both running and finished applications
 kill a running application (if you have submitted the job yourself or if you have been assigned admin rights)
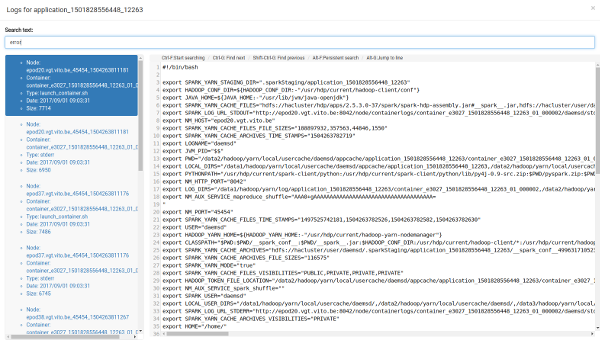
When retrieving the logs a dialog will appear, showing the logs for the job. On the left, the used executor nodes and log types (stdout/stderr) are shown. Selecting an entry on the left will update the log entries displayed on the right.
By default, logs from all exectors are shown. It is possible to filter the executors nodes on occurence of a string, e.g. by typing "error" in the "Search text" field as shown below:
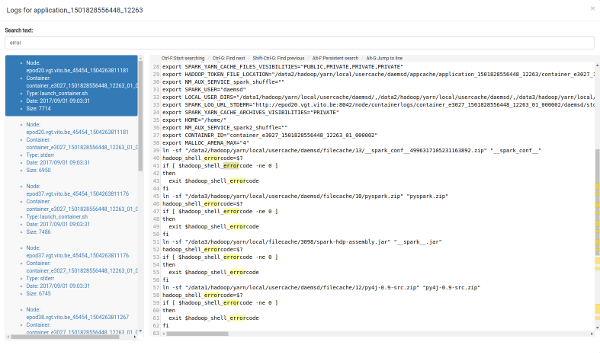
Within an executor log, you can search for and navigate between occurences of this text. The occurences will be highlighted:


