Land Cover map over Africa based on PROBA-V 100 m data
Bruno Smets, VITO-TAP, Belgium
Marcel Buchhorn, VITO-TAP, Belgium

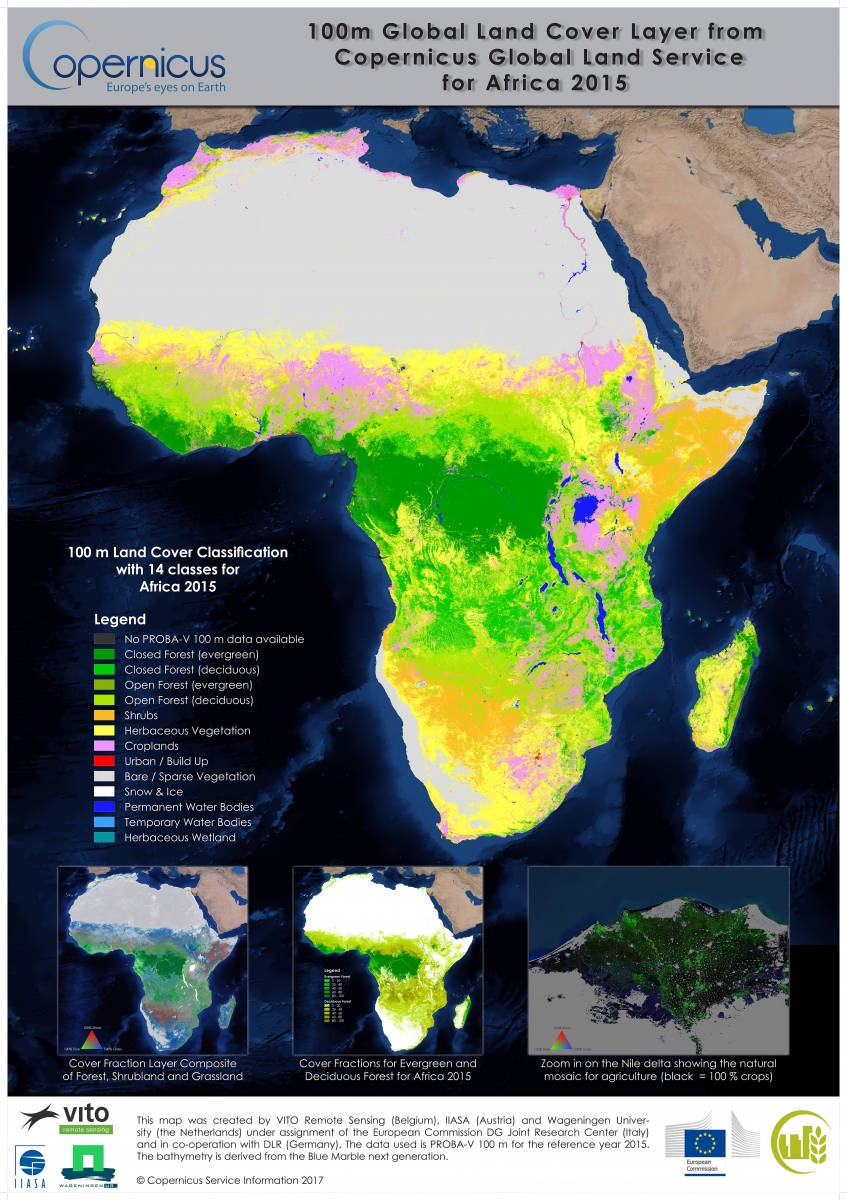
Organizations first have to know the physical coverage of the Earth’s surface, its use and its dynamics to for example tackle deforestation or loss of biodiversity. The Copernicus Global Land Service is an operational service from the European Commision to monitor the Earth’s surface. The service provides a suite of products ranging from vegetation, energy budget at the surface, water to cryosphere themes, and has generated its first land cover map. This land cover map provides spatial information about the land for a diversity of applications ranging from global forest monitoring, global crop monitoring, biodiversity and nature conservation to climate modelling.
By merging remote sensing imagery with other ancillary data sources, a highly automated, accurate and cost efficient Land Use and Land Cover (LULC) and Land Use and Cover Change (LUCC) solution generates yearly land cover maps, following the classification scheme of the FAO Land Cover Classification System (LCCS). This first land cover map covers the Africa continent at 100m spatial resolution, has been generated on the PROBA-V Mission Exploitation platform, and provides a set of continuous cover layers to provide land information representing 10m spatial coverage. The team has started its second phase to upscale the map to cover the entire globe and integrate Sentinel-2 higher details for selected regions.
Processing with 1200 executers and 5TB memory on the Hadoop Spark platform
The land cover map and its continuous layers were generated on the PROBA-V Mission Exploitation Platform. The product was created through a complex workflow consisting of 18 different steps, written in python and using the Scalable Hadoop Spark platform with its set of installed libraries. During the generation of the map, the platform was loaded up to 80% (1200 executers and 5TB memory) to process the 10.5 TB input data. The most demanding step requires 5588 CPU-hours and the processing time was cut to 22 hours using the MEP, hence a time saving of 99.6%. Through this time-saving, several iterations were possible to tune the map to maximize its accuracy. Visual checks and comparisons were performed in the Developer Virtual Machines as well as in an external Geo-WIKI platform.
The main benefits to generate the land cover map on the MEP are the direct access to the EO data input (PROBA-V 100 m and 300 m data), the ability to upload ancillary datasets and of course its scalability to use more than 1000 processors. The consistency across the virtual machines and the actual Hadoop cluster enabled us to have a smooth transition from the initial development (no Hadoop Spark use) through testing phase (using local Hadoop Spark inside the virtual machine) to final production phase (using the Hadoop Spark cluster). The openness of the platform enabled us to install & test new efficient libraries and the support of the MEP team brought a few of these libraries into the Hadoop cluster.
Monitoring the progress of the jobs in progress is easy done through the web monitor, however an area of improvement is to ease the finding of the root cause of failed jobs. Per today a very large amount of job information needs to be collected from the cluster and results in a large log file that is not so easy to search. The log file provides a lot of additional Spark information intermixed with the actual real logging and if the error resides from the Spark context, the information is not always that descriptive to find easily the root cause.
The Copernicus global land service intends to use the MEP platform in a larger extend. Next to generating the land cover map of the second phase, we also target to migrate some of the daily (to 10-daily) operational chains into the MEP platform. To support operational excellence, the MEP however needs to prioritize production to research jobs, as is continue optimizing the platform using dynamic resource allocation with priority pre-emption schemes.
Another area of interest are the higher resolution Sentinel-2 algorithms, The MEP could largely benefit from having Sentinel-2 and preferably also historical Landsat datasets available in the platform.
A 3rd area of interest is to further exploit the ipython notebook concept for image quality monitoring and analysis. The notebook is currently already installed, however providing direct access to local (mounted) data would further enhance the use of it.
References
The Copernicus global land service is operated under contract by the European Commission Joint Research Centre and more information can be found at http://land.copernicus.eu/global. The land cover map is generated under this contract.
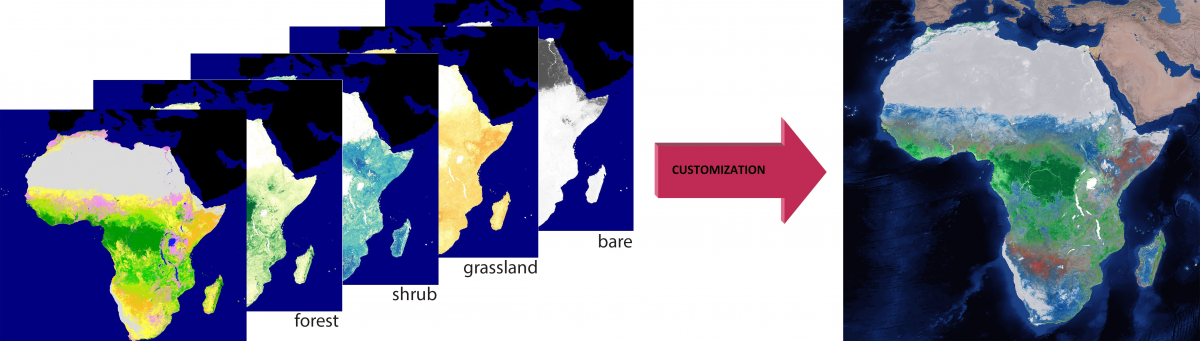
Figure 2: Land cover products in 100 m resolution (left to right: basic discrete map, forest cover fractions, shrub cover fractions, grassland cover fractions, and bare cover fractions) can be combined, clipped or re-classified to create your own customs land cover map (right). © Copernicus Service Information