Detection of Disturbances in Natural Vegetation
Clement Atzberger – BOKU, Austria
Anja Klisch – BOKU, Austria
Kathrin Einzmann – BOKU, Austria

Disturbances of forests and natural vegetation occur naturally and are important for forest ecosystems. With changing climate these biotic (e.g. insect outbreak, fungi and nematode) and abiotic (e.g. windthrow and forest fires) calamities are occurring more frequently (Seidl et al., 2011, Seidl et al. 2014). This is a challenging task for forestry and natural resource management, since the disturbances cause ecological and economical loss (Hanewinkel et al, 2012). However, only incomplete information is available about the location and intensity of the affected areas, in particular for actors overseeing very large areas.
The objective of this activity is to demonstrate a novel approach to detect disturbances in natural vegetation focussing on disturbances in forested areas of Europe (e.g., caused by forest clearing, windthrow, pathogens and fires) using change-detection analysis of multi-sensor temporal series of EO data.
Proba-V MEP provides a very flexible environment with easy and fast access to the full Proba-V S5 time series and additional input data (e.g. MODIS climatologies) can be uploaded via SSH. Different regions of interest and long time series can be easily processed by parallelizing which makes the Proba-V MEP VM particularly well suitable for testing algorithms but also for operational processing. With the given capacity of the Proba-V MEP VM (RAM, cores, storage), the processing could be easily extended to other and larger regions of interest.
Using Proba-V at 100m resolution to extend MODIS time series and to provide higher resolution
To enable the use of 100 m Proba-V data, the combination of Normalized Difference Vegetation Index (NDVI) data from two sources was needed:
- historical filtered and interpolated MODIS NDVI times series at 250 m GSD derived from MOD13Q1 and MYD13Q1 products of NASA’s LPDAAC
- near real-time Proba-V NDVI S5 top of canopy (TOC) data at 100 m GSD from the Proba-V Mission Exploitation Platform (MEP)
The idea is to leverage on the one hand, the length of the available time series from MODIS (starts in 2002) and, on the other hand, use the higher spatial resolution of Proba-V with up to 100 m pixel size. This resolution is significantly better than the 250 m (nominal) of MODIS and probably better adopted to the size of many disturbances occurring in Europe.
The current activity relies on historical MODIS data. A dedicated filtering and interpolating procedure (Klisch et al., 2016) is used before extracting statistical measures from the MODIS time series (e.g. median, median of absolute difference) representing the MODIS climatology.
The basic near real-time processing steps are displayed in Figure 1. Anomaly indicators (e.g. modified z-score) have been employed to derive weekly updated disturbance raster data and shapefiles.
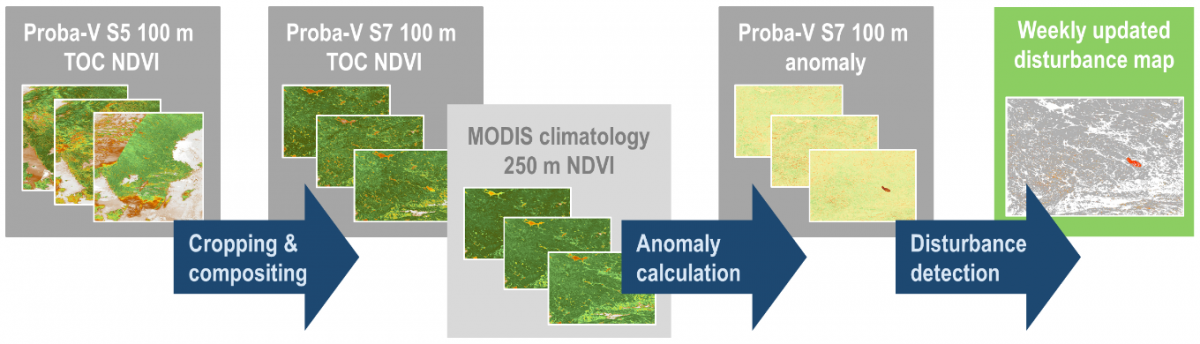
Figure 1: Processing steps for deriving weekly updated disturbance maps.
Two regions of interest (ROI) have been identified as use cases to demonstrate the effectiveness of this activity:
- The first ROI is located in Bavaria, Germany. In March 2015, spring storm ‘Niklas’ caused wide spread forest damage mostly south of Munich. The affected area contains patches with varying size of up to 10 ha, but mostly < 5 ha. This permits us to test the tool for detecting storm-caused damages.
- The second ROI covers the region of Västmanland in Sweden. Västmanland has been hit by a wildfire end of July/beginning of August 2014. An area of over 15,000 hectares was affected mostly consisting of forest but also grassland. This site therefore permits to evaluate the approach for detecting forest fire related disturbances.
Detection of Disturbances tool running on Proba-V MEP
The tool is implemented on a virtual machine (VM) on the Proba-V MEP which is easily accessible using the X2Go Client. The activity is relying on open source software. All processes are implemented in the R programming language including associated libraries. RStudio has been used for code development and debugging. Input and output data were displayed in QGIS. Since January 2018, disturbance products are operationally processed for every Monday.
At the same time, the VM provides an easy and fast access to the full Proba-V S5 time series. Additional input data (e.g. MODIS climatologies) have been transferred via SSH.
Different regions of interest and long time series can be easily processed by parallelizing.
Validation results
A first validation of the software has been done for the disturbance events in Germany 2015 and Sweden 2014 in hindcasting mode. An equal number of reference points falling into disturbed and undisturbed areas for both ROIs were defined by visually inspecting available spatially high-resolution images such as Microsoft Bing, Google Maps and Google Earth.
Figure 2 (top) shows Proba-V S7 NDVI (green line) and calculated anomalies (blue line) for two reference points. Disturbance events can be detected if the anomaly indicator falls below a threshold (red horizontal line) for a certain period of time. The validation in Figure 2 (bottom) has been done comparing the reference points (truth) with the extracted software output at the reference points (test).
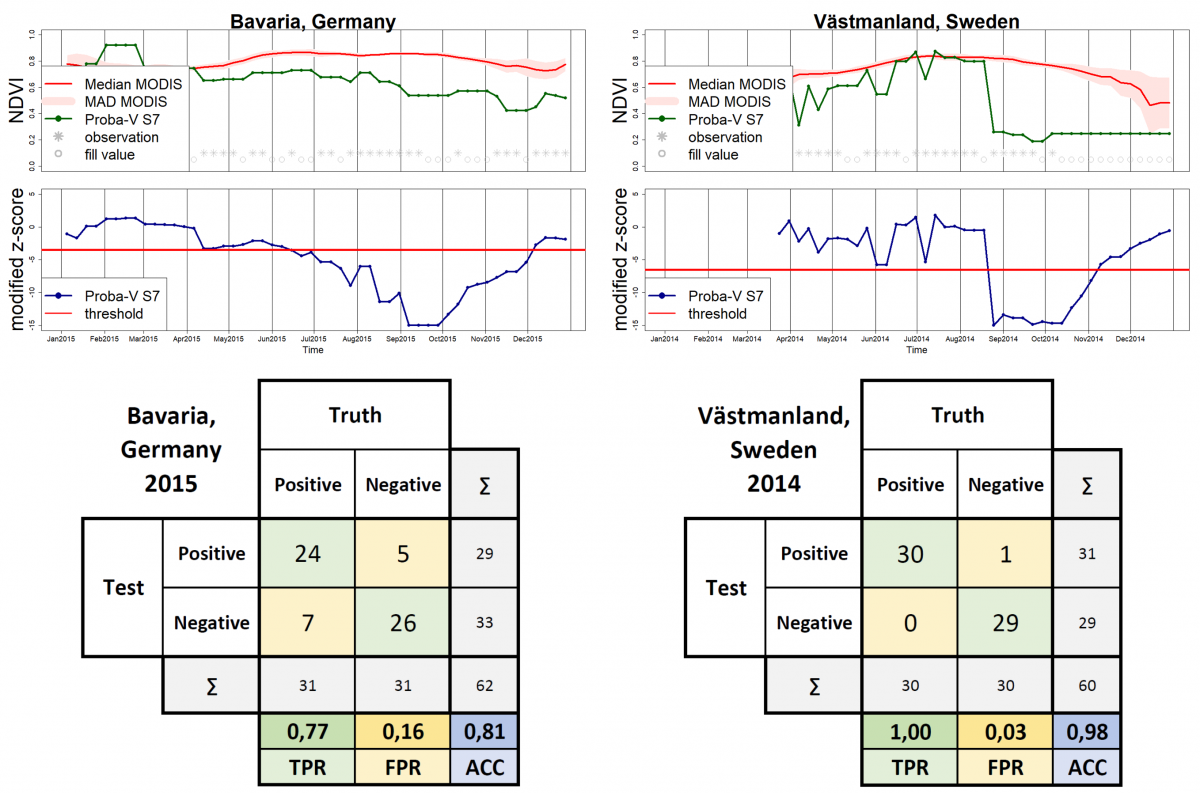
Figure 2: (top) Proba-V S7 NDVI, MODIS climatology and modified z-score for two disturbed pixels; (bottom) validation results of disturbance maps using the modified z-score as anomaly indicator for (left) windthrows in 2015 and (right) a wildfire in 2014; TPR - true positive rate, FPR – false positive rate, ACC – accuracy
The validation results clearly demonstrate:
- The software is able to reliably detect disturbance events within relatively short time lags.
- There is a clearly better accuracy for detecting wildfire-related disturbances (Västmanland) than for the detection of windthrow disturbances (Bavaria).
- The spatial resolution offered by Proba-V (100 m) is certainly a limiting factor for disturbance detection, in particular for detecting small-scale windthrow areas (e.g. in the magnitude <= 5 ha). In addition, the statistical reference information is currently provided at even coarser resolution (250 m from MODIS).
Future evolutions
As a first step, the procedure can be applied to the whole of Austria providing disturbance products to large forest stakeholders such as ÖBF (Österreichische Bundesforste) in Austria.
A Jupyter notebook could be a good option to transparently describe the algorithms and the validation process for the scientific community.
References:
- Hanewinkel, M., Cullmann, D.A., Schelhaas, M.-J., Nabuurs, G.J., Zimmermann, N.E. (2012): Climate change may cause severe loss in economic value of European forestland. Nature Climate Change 3: 203-207. DOI: 10.1038/nclimate1687
- Klisch, A., Atzberger, Clement (2016): Operational Drought Monitoring in Kenya Using MODIS NDVI Time Series. Remote Sensing 18. DOI: 10.3390/rs8040267. https://ivfl-arc.boku.ac.at/kenya/map/
- Seidl, R., Schelhaas, M.J. & Lexer, M.J. (2011): Unraveling the drivers of intensifying forest disturbance regimes in Europe. Glob. Change Biol. 17, 2842–2852.
- Seidl, R., Schelhaas, M-J., Rammer W., Verkerk, P.J. (2014). Increasing forest disturbances in Europe and their impact on carbon storage. Nature Climate Change. DOI: 10.1038/nclimate2318