Desert Locust habitat monitoring using PROBA-V 100 m
Inès Moreau - UCL, Belgium

This on-going UCL activity on PROBA-V MEP aims to improve the monitoring of the Desert Locust habitat. Food security of 60 countries in Northern Africa and Asia is intermittently threatened by this insect, which can form swarms of billions of individuals that damage crops and pastures. To fight Desert Locust, FAO recommends early warning and rapid response to prevent locust upsurges and the formation of large swarms. This preventive strategy needs information on annual vegetation that is recently becoming green, required for locust breeding and preferred by the insect.
The goal of this activity is to adjust and implement the existing Greenness timer algorithm to PROBA-V 100 m time series. This algorithm is designed to detect from satellite time series the temporary habitat of the Desert Locust by discriminating vegetated from non-vegetated pixels on each decade. First developed by UCL for SPOT-VEGETATION (Pekel et al., 2010), it is now operationally applied with MODIS 250 m time series through the generation of Dynamic Greenness Maps in the context of the FAO Locust Watch System.
The PROBA-V MEP allows UCL applying the processing chain on PROBA-V 100 m time series and providing Dynamic Greenness Maps at a much finer scale to FAO. This is especially interesting in fragmented habitat and will contribute to improve the early warning system for the affected countries.
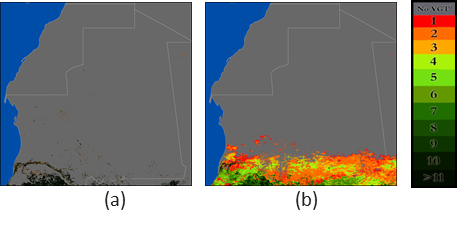
Figure 1. Dynamic Greenness Map (MODIS 250 m) products for Mauritania on two contrasted dates: (a) second decade of February 2011; and (b) first decade of September 2011; (c) the color code of the time meter. This illustrates the spatial-temporal variability of vegetation and the vegetation response to seasonal rainfall. The product, with its time meter, flags priority areas to be surveyed (warm colors) because of a recent greening of vegetation becoming suitable for locusts, as they prefer fresh vegetation. On the contrary, dark-colored areas present a lower interest for locusts. From Wadlner et al., 2015.
N-daily Compositor at 100 m resolution and greenness time algorithm running on a VM
First, the N-Daily Compositor was used to generate 10-day cloud-free composites at 100 m resolution for a few months, choosing the appropriate compositing algorithm. These composites were used firstly for the assessment of the cloud screening performance and of the quality of the composites, and secondly for testing and adjusting the Greenness timer algorithm to this new dataset.
Once all components were adapted to PROBA-V data, the Virtual Machine was used to implement the Greenness timer algorithm on one year of data for an area of interest defined by FAO (Mauritania and Mali) where field data are available for validation.
Thanks to the direct access to the complete PROBA-V archive, to the powerful set of tools and libraries and to the reliability of Virtual Machines, this implementation was very straightforward. In addition, the use of 300 m time series for gap filling, not planned at the beginning of the project, has been easily possible as all archives of all resolutions (100 m – 300 m – 1 km) are available on Virtual Machines.
User-friendly and easy to handle tools
Interfaces of the MEP tools are user-friendly and easy to handle. The website is very clear and all tools are well documented. The helpdesk is very reactive and responded always to the requests (even if sometimes the solution took time to be implemented).
Having access to the complete PROBA-V archive for all resolutions, in a efficient and customizable working environment, is clearly the strength of the PROBA-V MEP. It provides flexibility during the implementation phase as it allows using quickly any data. An improvement could be that all the tools of the MEP, currently used in separated environment (online, VM, notebooks), could be brought together in a single interface to facilitate the interaction between their output.
The Geoviewer supports S5 composites at 100 m data, as these are provided by the PROBA-V user segment. Supporting S10 composites at 100 m resolution (if they become available but which depends on the PROBA-V roadmap ) would be an asset and being able to choose the bands of the composites in the Geoviewer would be a nice feature.
The N-Daily compositor application performs well, and offers high flexibility. Since iteration 3 the MEP supports launching composites of more than 30 days, which can be important for land cover mapping use cases (yearly composites, seasonal composites,... depending on the region of the world). Another interesting improvement since iteration 3 is that the application allows to choose monthly regular composite dates starting at same date of each month. Finaly, improve the quality of the status mask at 100 m resolution, especially concerning cloud shadow will benefit to PROBA-V derived products.
Time Series Viewer supports historical SPOT-VEGETATION data
A forum on the MEP which is available since iteration 3, mid 2018 is a good way to exchange experience and to learn from other users.
The support of SPOT-VEGETATION in the Time Series viewer, which is added in Nov 2017 is very useful for UCL. Extending the application with access to individual reflectance would be an interesting future evolution. It will help visualizating and assessing the different range of reflectance between SPOT-VEGETATION and PROBA-V, which is an important aspect when using both together.
Produce maps in near real time for the entire Desert Locust area
For FAO, Dynamic Greenness Maps produced with the PROBA-V 100 m time series represent a significant improvement compared to the current MODIS 250 m maps they use. They asked UCL to produce these 100m maps in near real time for the entire Desert Locust area. With the help of the Orchestrator Service (Space Applications) for automatisation of the processing chain, this application could be runned as an operational product on the PROBA-V MEP.
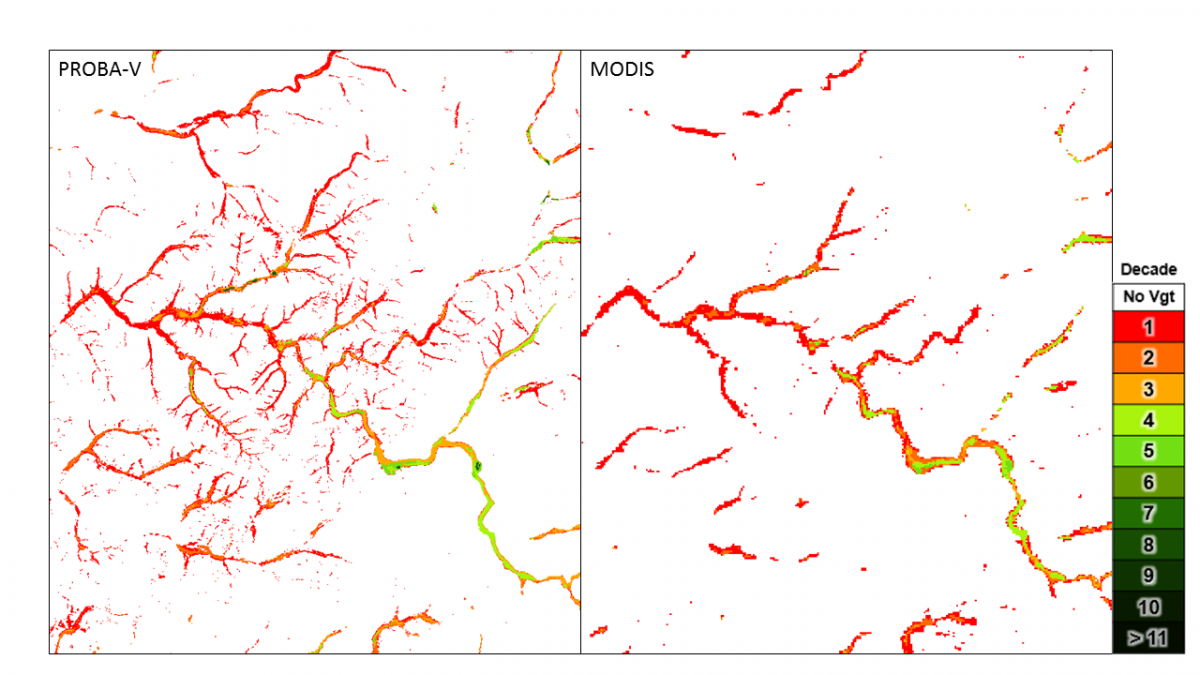
Figure 2. Dynamic Greenness Map products for North Mali on the first decade of September 2016 for PROBA-V and MODIS. This illustrates the significant improvement of the greenness map thanks to the use of PROBA-V time series, with a much better delineation of this fragmented area while having a good consistency with the MODIS product. PROBA-V maps allow also an earlier detection of vegetation compared to the MODIS maps. The product, with its time meter, flags priority areas to be surveyed (warm colors) because of a recent greening of vegetation becoming suitable for locusts, as they prefer fresh vegetation. On the contrary, dark-colored areas present a lower interest for locusts.
References
Pekel, Jean-François ; Ceccato, Pietro ; Vancutsem, Christelle ; Cressman, Keith ; Vanbogaert, Eric ; Defourny, Pierre. Development and Application of Multi-Temporal Colorimetric Transformation to Monitor Vegetation in the Desert Locus Habitat. In: IEEE Journal of Selected Topics in Applied Earth Observation and Remote Sensing, 1939-1404, 9 (2010). doi: 10.1109/JSTARS.2010.2052591.
Renier, Cécile ; Waldner, François ; Jacques, Damien ; Babah Ebbe, Mohamed ; Cressman, Keith ; Defourny, Pierre. A Dynamic Vegetation Senescence Indicator for Near-Real-Time Desert Locust Habitat Monitoring with MODIS. In: Remote Sensing, Vol. 7, no. 6, p. 7545-7570 (2015). doi:10.3390/rs70607545.
Waldner, François ; Abdallahi Babah Ebbe, Mohamed ; Cressman, Keith ; Defourny, Pierre. Operational Monitoring of the Desert Locust Habitat with Earth Observation. In: I S P R S International Journal of Geo-Information, Vol. 4, no.4, p. 2379-2400 (30 October 2015). doi:10.3390/ijgi4042379.