Evapotranspiration estimation based on PROBA-V
José Miguel Barrios - Royal Meteorological Institute of Belgium

Evapotranspiration (ET) is the flux of water from the Earth’s surface into the atmosphere. This water flux results from water evaporation and plant respiration and its estimation is required for a number of applications as it provides valuable information on the water cycle and the Earth’s surface energy balance.
The Royal Meteorological Institute of Belgium (RMI) has developed -in the framework of the EUMETSAT’s LSA-SAF initiative- an operational service for estimating ET in near-real time (https://landsaf.ipma.pt). This product adopts the spatial resolution and extent of the observations by the SEVIRI sensor onboard the Meteosat Second Generation (MSG) satellite. The high temporal resolution of the LSA-SAF ET product is a big asset. The spatial resolution, however, can still be too coarse for a certain number of applications over non-homogeneous areas.
In this respect RMI is evaluating the use of Proba-V-derived products to enhance the spatial detail of ET estimates. The Proba-V-based LAI is of particular interest for testing statistical downscaling techniques towards the estimation of daily ET.
A Virtual Research Environment with the wealth of data and tools
In pursuing our goals, the MEP virtual machine (VM) has been particularly useful. The most relevant aspect is the wealth of geospatial data readily available there. The set of Proba-V images in geotiff format has been particularly useful. This aspect will become even more important in our future work as we intend to extend the scope of our work from mostly European study sites to ecosystems all over the world.
Other important feature of the VM is the set of scientific software tools made available for scripting and visualization. The possibility of scripting in Python or R and performing analysis and other procedures for spatial layers in GRASS GIS has been an attractive element of the VM. Since these tools are available in our local machines as well, much of the work can be done indistinctly in our local machines and in the VM.
So far I have used only the Virtual Machines (also Jupyter Notebooks, but not extensive) and I am very satisfied.
A major strength of MEP is the fast availability of data originating from remote sensing. A useful complement to these datasets for our purposes would be the incorporation of Sentinel-3 observations in the available datasets. Also, a number of “static” or basic layers would be useful; for instance, land cover (like ESA-CCI), climatic regions (like the Köppen classification), country borders, etc.
The current features of Virtual Machines do allow us to perform the work which we envisage for the coming months and we will keep on using the Proba-V MEP as we do today. If the Proba-V MEP provides access to Sentinel-3 data and derived vegetation products, the platform remains interesting for us in the coming years.
References - results
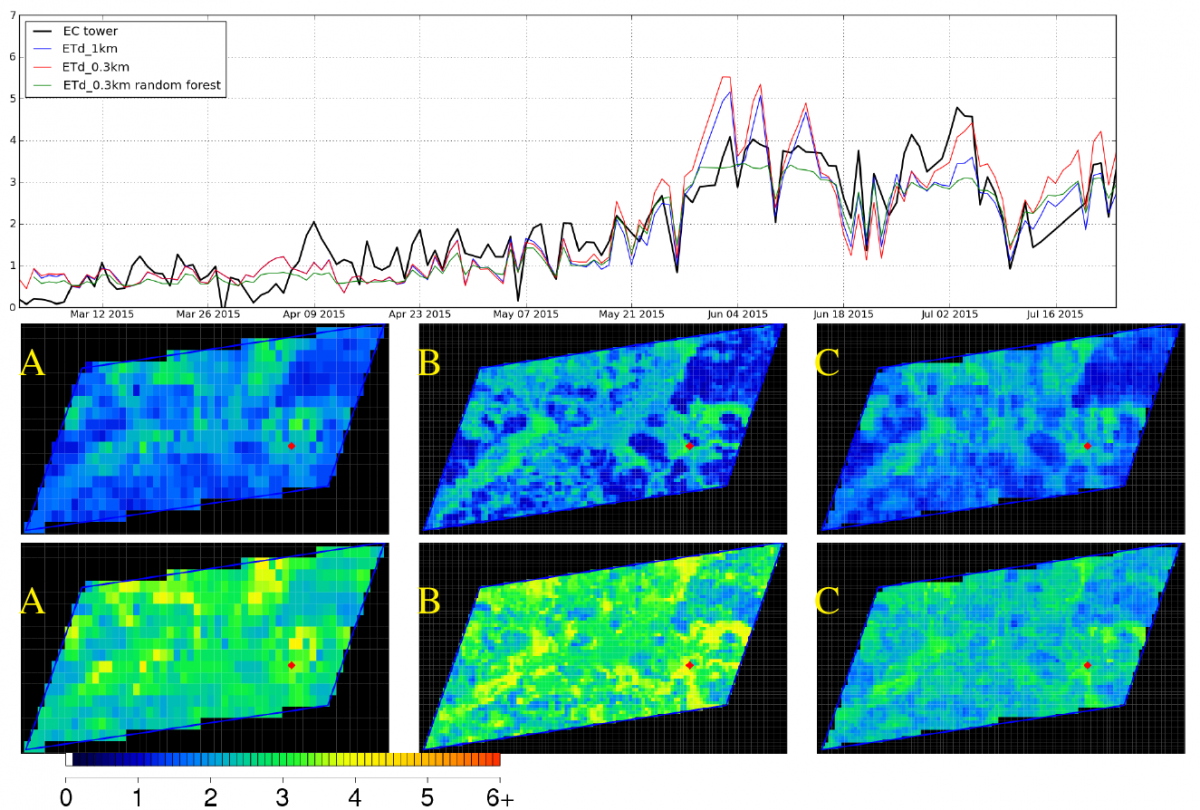
Estimates of daily ET have been derived at 1 km and 0.3 km spatial resolutions, i.e. over the grids of Proba-V 1 km and 0.3 km imagery. The ET estimates resulted from performing a pixel-based energy balance forced by satellite and meteorological data in addition to parameters related to the land cover class. In this exercise the 1 km estimates were statistically downscaled through Random Forest modelling. The seasonal patterns of vegetation were obtained from Proba-V observations and were key for achieving the target spatial resolutions. The study was performed in the upper basin of the Biebrza river, in Poland in the framework of the HiWet project funded by BELSPO (contract SR/00/301). Figure 1 shows the modelled ET time series as contrasted with validation data obtained from an eddy covariance station as well as ET maps for two dates.
Figure 1: Daily ET (mm/day) as modelled at 1km (A), 0.3km (energy balance) (B) and 0.3km (random forest)(C) for May 30, 2015 (top) and July 9, 2015 (bottom) over the upper part of the Biebrza catchment. The red diamond symbol represents the location of the EC tower